
Applicant numbers are at record levels and more students have secured university places than at the same stage last year. But applicant numbers are growing faster than placements, meaning a slightly larger proportion are still looking for a place.
At the same time, Clearing is playing an increasingly important role, subject performance is diverging and competition for students continues to shift.
So, what is the latest data telling us?
A-level results remained strong
Starting with Results Day itself, the overall A-level pass rate remained at 97.5%, with a slight increase in the proportion of A* grades.
There were some interesting shifts in subject choices too. Maths remained the most popular A-level, while Economics saw particularly strong growth in entries.
At university level, a record 262,820 UK 18-year-olds secured a place on Results Day, up 3% on last year.
However, the 18-year-old population is larger and, despite the increase in actual student numbers, the proportion progressing to higher education was slightly lower than last year.
Two weeks into the cycle, that underlying picture remains.
More applicants – but placements haven’t kept pace
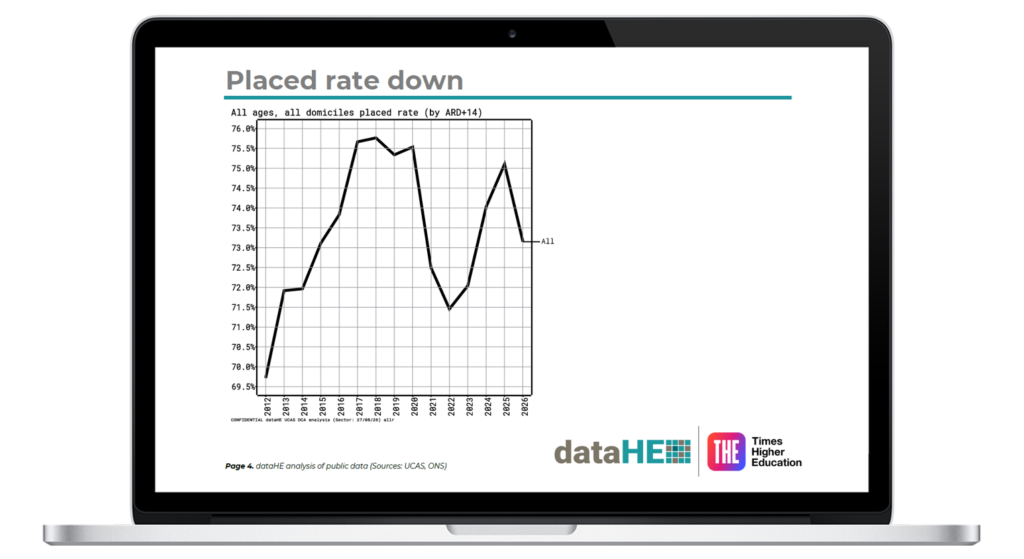
By 27 August, around 708,500 applicants had entered the UCAS cycle, compared with around 682,000 at the same point last year – an increase of approximately 4%.
The number securing a place had also increased, reaching around 509,000, but growth was lower at approximately 2%.
As a result, the overall proportion of applicants placed is lower than it was at the same stage last year.
It’s an important distinction. The recruitment market is bigger in absolute terms, but that larger applicant pool hasn’t translated proportionately into more placed students.
Clearing is carrying more of the load
Two weeks after Results Day, the latest figures show Clearing continuing to play a significant role in this year’s recruitment cycle:
- 63,480 applicants had secured a place through Clearing, compared with 60,830 at the same point last year – around 4% higher.
- Within this, Main Scheme Clearing placements were around 7% ahead year on year, growing faster than overall placements, which were up around 2%.
- 148,700 applicants were still free to be placed in Clearing, around 12% more than at the same point last year.
- Of those, 122,470 were opted in to receive UCAS email communications – including 73,855 UK/Islands applicants and 48,615 international applicants. This opted-in audience has grown despite more applicants securing places through Clearing.
- London remains the largest opted-in UK audience at 15,660, followed by the North West (8,595) and South East (8,415).
Clearing isn’t driven only by students who were unplaced on Results Day. 43,180 applicants had used Decline My Place, around 8% more than at the same point last year. Of those, 56.8% had subsequently secured another place, compared with 61.6% last year.
This suggests more students are reconsidering their original choice this year, although a smaller proportion have secured another place at this point in the cycle.
Subject demand is moving in different directions
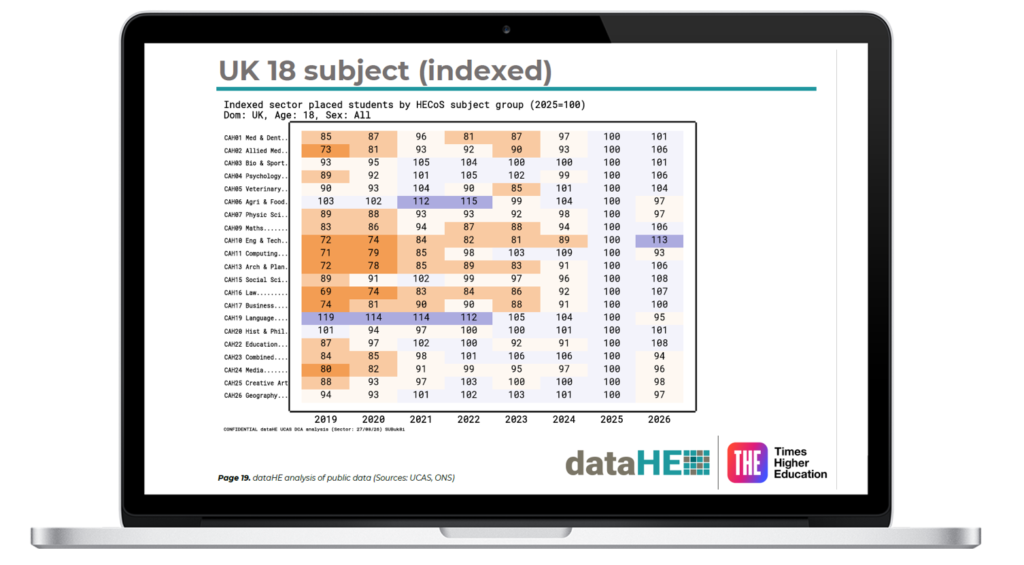
One of the clearest trends this year continues to be the difference between subjects.
Among UK 18-year-olds, Engineering & Technology placements are around 13% ahead of 2025, while Social Sciences are around 8% higher, Law around 7% and Mathematics around 6%.
Computing, meanwhile, remains around 7% below last year.
Other areas remain under pressure, including Languages, Media, Creative Arts and Agriculture.
There isn’t, therefore, one single Clearing market. The available opportunity – and the level of competition – can look very different depending on the course.
Entry rates remain slightly lower
Despite record applicant numbers, the UK 18-year-old entry rate is 35.4%, down from 36.0% at the same point last year.
The picture varies slightly across the UK, with England, Wales and Northern Ireland below last year, while Scotland is slightly ahead.
Competition for students
Higher-tariff providers continue to strengthen their position. As the chart below shows, their share of higher-fee 18-year-old placements has risen to around 19% – the highest level in dataHE’s series.

For universities, that means the competitive set may be wider than it has been in previous cycles. The Clearing market may be larger, but the opportunity isn’t being distributed evenly across the sector.
International remains a mixed picture
International demand is also worth watching closely.
Overall, 63,560 international applicants had been accepted by 27 August, 4% more than at the same point last year.
China remains the standout market. By 27 August, Chinese acceptances had reached around 17,500, a new high and approximately 15% ahead of the same point last year.
India, by comparison, is only slightly ahead of 2025.
International growth cannot be viewed as one consistent trend, and the latest figures reinforce the importance of understanding individual source markets rather than relying on the overall international picture.
Cost could be influencing choices too
One wider Results Day story caught our attention.
The Financial Times reported that more than 31% of UK 18-year-olds accepting a university place indicated they planned to live at home on at least one application, compared with 21% in 2017.
With cost-of-living pressures continuing, location, commuting distance and the overall cost of the university experience could become increasingly important considerations.
For recruitment teams, this potentially strengthens the case for more locally focused activity and messaging – particularly when there are still significant pools of unplaced students across different regions.
And what about AI?
There’s also another change happening earlier in the student journey.
UCAS research found that 88% of students surveyed had used AI, and among those users, 48% had used it to explore higher education options.
But that doesn’t mean official university information is becoming less important. 43% said a university website would still be their first place to go for information, while 73% had encountered incorrect or misleading information from AI.
What may be changing is when students arrive at a university website and what they expect to find when they get there.
AI can help students create an initial shortlist, compare courses or understand their options before they visit UCAS or a university directly. By the time they reach the official site, they may already have much more specific questions.
So, what does Clearing 2026 tell us?
Applicant numbers are at record levels, up around 4% on last year, while the number securing a place is up around 2%. This means a slightly smaller proportion of applicants have been placed so far.
Clearing is playing a greater role in converting that demand, while almost 149,000 applicants remain free to be placed – around 12% more than at the same point last year.
But the opportunity isn’t evenly distributed.
Different subjects are moving in different directions. UK 18-year-old entry rates remain slightly below last year. Higher-tariff providers continue to strengthen their position. International demand varies significantly by market, with China currently driving much of the growth.
Cost may also be influencing how far students are prepared to travel, while AI is becoming another part of how students discover and compare their options.
For universities still recruiting, the opportunity isn’t simply about maintaining visibility throughout Clearing. It’s about understanding where the remaining demand sits and where it is converting, then adapting recruitment activity as the market changes.